|
Download Data (XLS File) |
|
|||||
|
|||||
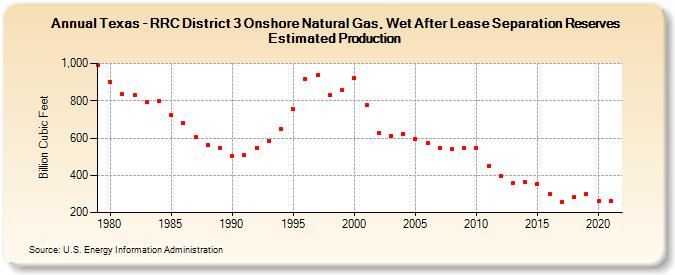
| Texas - RRC District 3 Onshore Natural Gas, Wet After Lease Separation Reserves Estimated Production (Billion Cubic Feet) | |||||
| Decade | Year-0 | Year-1 | Year-2 | Year-3 | Year-4 | Year-5 | Year-6 | Year-7 | Year-8 | Year-9 |
|---|---|---|---|---|---|---|---|---|---|---|
| 1970's | 992 | |||||||||
| 1980's | 902 | 834 | 830 | 791 | 801 | 722 | 683 | 604 | 564 | 547 |
| 1990's | 504 | 507 | 548 | 582 | 651 | 754 | 916 | 938 | 829 | 858 |
| 2000's | 922 | 775 | 628 | 610 | 621 | 596 | 572 | 547 | 539 | 545 |
| 2010's | 545 | 451 | 395 | 356 | 362 | 351 | 298 | 256 | 282 | 299 |
| 2020's | 262 | 263 |
| - = No Data Reported; -- = Not Applicable; NA = Not Available; W = Withheld to avoid disclosure of individual company data. |
| Release Date: 12/30/2022 |
| Next Release Date: NA |