|
Download Data (XLS File) |
|
|||||
|
|||||
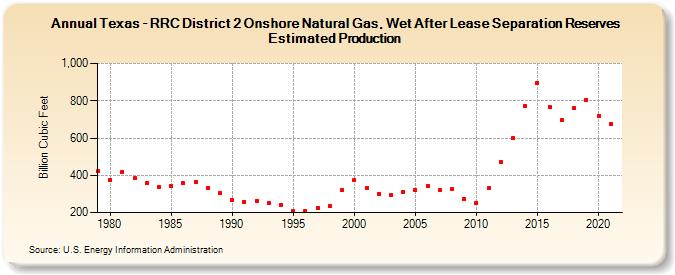
| Texas - RRC District 2 Onshore Natural Gas, Wet After Lease Separation Reserves Estimated Production (Billion Cubic Feet) | |||||
| Decade | Year-0 | Year-1 | Year-2 | Year-3 | Year-4 | Year-5 | Year-6 | Year-7 | Year-8 | Year-9 |
|---|---|---|---|---|---|---|---|---|---|---|
| 1970's | 421 | |||||||||
| 1980's | 376 | 418 | 384 | 357 | 335 | 344 | 356 | 364 | 333 | 304 |
| 1990's | 268 | 259 | 263 | 250 | 242 | 207 | 206 | 227 | 234 | 321 |
| 2000's | 373 | 333 | 302 | 295 | 311 | 320 | 340 | 319 | 327 | 275 |
| 2010's | 253 | 330 | 471 | 600 | 772 | 894 | 765 | 696 | 760 | 805 |
| 2020's | 720 | 677 |
| - = No Data Reported; -- = Not Applicable; NA = Not Available; W = Withheld to avoid disclosure of individual company data. |
| Release Date: 12/30/2022 |
| Next Release Date: NA |