|
Download Data (XLS File) |
|
|||||
|
|||||
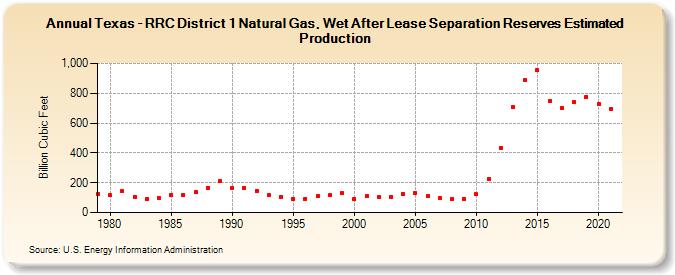
| Texas - RRC District 1 Natural Gas, Wet After Lease Separation Reserves Estimated Production (Billion Cubic Feet) | |||||
| Decade | Year-0 | Year-1 | Year-2 | Year-3 | Year-4 | Year-5 | Year-6 | Year-7 | Year-8 | Year-9 |
|---|---|---|---|---|---|---|---|---|---|---|
| 1970's | 127 | |||||||||
| 1980's | 115 | 142 | 104 | 91 | 99 | 120 | 121 | 135 | 166 | 210 |
| 1990's | 166 | 163 | 145 | 117 | 102 | 93 | 93 | 112 | 117 | 131 |
| 2000's | 92 | 109 | 103 | 104 | 124 | 133 | 114 | 97 | 90 | 90 |
| 2010's | 122 | 226 | 436 | 707 | 888 | 954 | 745 | 703 | 741 | 777 |
| 2020's | 728 | 695 |
| - = No Data Reported; -- = Not Applicable; NA = Not Available; W = Withheld to avoid disclosure of individual company data. |
| Release Date: 12/30/2022 |
| Next Release Date: NA |