|
Download Data (XLS File) |
|
|||||
|
|||||
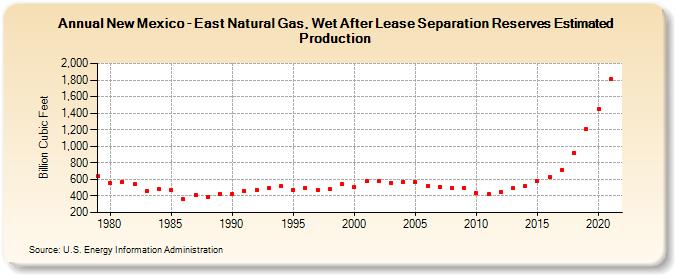
| New Mexico - East Natural Gas, Wet After Lease Separation Reserves Estimated Production (Billion Cubic Feet) | |||||
| Decade | Year-0 | Year-1 | Year-2 | Year-3 | Year-4 | Year-5 | Year-6 | Year-7 | Year-8 | Year-9 |
|---|---|---|---|---|---|---|---|---|---|---|
| 1970's | 637 | |||||||||
| 1980's | 555 | 572 | 539 | 464 | 480 | 468 | 359 | 415 | 393 | 429 |
| 1990's | 426 | 459 | 477 | 501 | 515 | 468 | 494 | 476 | 481 | 544 |
| 2000's | 506 | 576 | 581 | 562 | 565 | 569 | 526 | 508 | 502 | 500 |
| 2010's | 438 | 420 | 446 | 493 | 515 | 586 | 630 | 718 | 925 | 1,205 |
| 2020's | 1,449 | 1,809 |
| - = No Data Reported; -- = Not Applicable; NA = Not Available; W = Withheld to avoid disclosure of individual company data. |
| Release Date: 12/30/2022 |
| Next Release Date: NA |