|
Download Data (XLS File) |
|
|||||
|
|||||
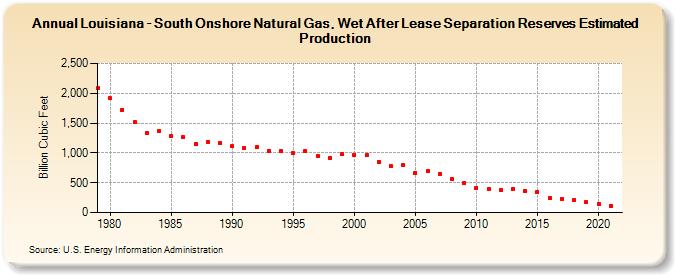
| Louisiana - South Onshore Natural Gas, Wet After Lease Separation Reserves Estimated Production (Billion Cubic Feet) | |||||
| Decade | Year-0 | Year-1 | Year-2 | Year-3 | Year-4 | Year-5 | Year-6 | Year-7 | Year-8 | Year-9 |
|---|---|---|---|---|---|---|---|---|---|---|
| 1970's | 2,088 | |||||||||
| 1980's | 1,914 | 1,727 | 1,516 | 1,341 | 1,368 | 1,282 | 1,260 | 1,152 | 1,184 | 1,169 |
| 1990's | 1,113 | 1,081 | 1,093 | 1,040 | 1,030 | 991 | 1,025 | 955 | 916 | 980 |
| 2000's | 968 | 960 | 855 | 780 | 797 | 668 | 701 | 644 | 561 | 490 |
| 2010's | 410 | 387 | 373 | 398 | 365 | 348 | 241 | 235 | 216 | 173 |
| 2020's | 145 | 111 |
| - = No Data Reported; -- = Not Applicable; NA = Not Available; W = Withheld to avoid disclosure of individual company data. |
| Release Date: 12/30/2022 |
| Next Release Date: NA |