|
Download Data (XLS File) |
|
|||||
|
|||||
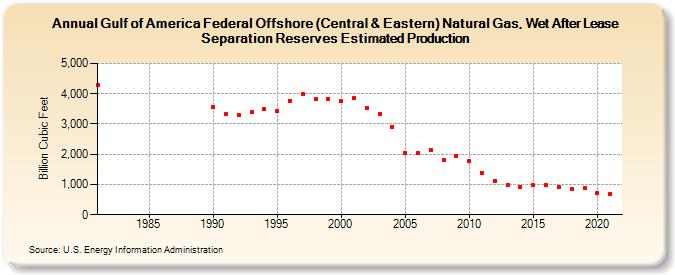
| Gulf of America Federal Offshore (Central & Eastern) Natural Gas, Wet After Lease Separation Reserves Estimated Production (Billion Cubic Feet) | |||||
| Decade | Year-0 | Year-1 | Year-2 | Year-3 | Year-4 | Year-5 | Year-6 | Year-7 | Year-8 | Year-9 |
|---|---|---|---|---|---|---|---|---|---|---|
| 1980's | 4,285 | |||||||||
| 1990's | 3,568 | 3,332 | 3,292 | 3,383 | 3,505 | 3,421 | 3,752 | 3,984 | 3,817 | 3,829 |
| 2000's | 3,747 | 3,843 | 3,540 | 3,330 | 2,890 | 2,056 | 2,036 | 2,135 | 1,807 | 1,947 |
| 2010's | 1,786 | 1,375 | 1,121 | 986 | 932 | 967 | 967 | 913 | 857 | 881 |
| 2020's | 723 | 692 |
| - = No Data Reported; -- = Not Applicable; NA = Not Available; W = Withheld to avoid disclosure of individual company data. |
| Release Date: 12/30/2022 |
| Next Release Date: NA |