|
Download Data (XLS File) |
|
|||||
|
|||||
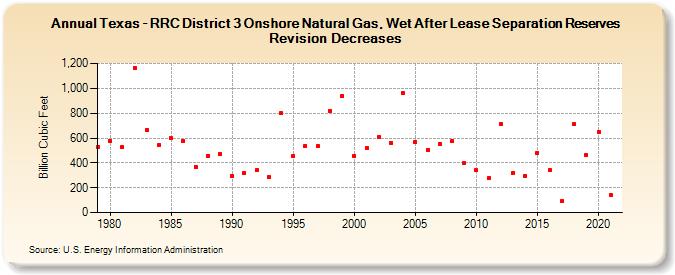
| Texas - RRC District 3 Onshore Natural Gas, Wet After Lease Separation Reserves Revision Decreases (Billion Cubic Feet) | |||||
| Decade | Year-0 | Year-1 | Year-2 | Year-3 | Year-4 | Year-5 | Year-6 | Year-7 | Year-8 | Year-9 |
|---|---|---|---|---|---|---|---|---|---|---|
| 1970's | 530 | |||||||||
| 1980's | 579 | 527 | 1,165 | 666 | 542 | 597 | 575 | 370 | 457 | 475 |
| 1990's | 296 | 319 | 341 | 285 | 800 | 455 | 535 | 535 | 820 | 940 |
| 2000's | 456 | 521 | 606 | 562 | 962 | 568 | 506 | 554 | 574 | 395 |
| 2010's | 342 | 277 | 712 | 319 | 298 | 480 | 342 | 95 | 709 | 464 |
| 2020's | 650 | 144 |
| - = No Data Reported; -- = Not Applicable; NA = Not Available; W = Withheld to avoid disclosure of individual company data. |
| Release Date: 12/30/2022 |
| Next Release Date: NA |