|
Download Data (XLS File) |
|
|||||
|
|||||
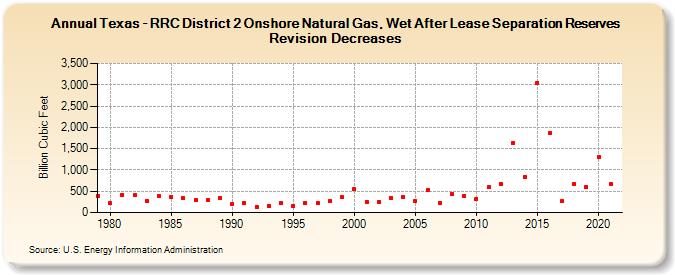
| Texas - RRC District 2 Onshore Natural Gas, Wet After Lease Separation Reserves Revision Decreases (Billion Cubic Feet) | |||||
| Decade | Year-0 | Year-1 | Year-2 | Year-3 | Year-4 | Year-5 | Year-6 | Year-7 | Year-8 | Year-9 |
|---|---|---|---|---|---|---|---|---|---|---|
| 1970's | 394 | |||||||||
| 1980's | 213 | 424 | 409 | 279 | 390 | 370 | 337 | 293 | 298 | 353 |
| 1990's | 196 | 227 | 138 | 161 | 222 | 157 | 227 | 221 | 274 | 355 |
| 2000's | 551 | 254 | 257 | 348 | 360 | 273 | 537 | 231 | 437 | 394 |
| 2010's | 323 | 593 | 673 | 1,642 | 840 | 3,053 | 1,864 | 276 | 678 | 596 |
| 2020's | 1,310 | 682 |
| - = No Data Reported; -- = Not Applicable; NA = Not Available; W = Withheld to avoid disclosure of individual company data. |
| Release Date: 12/30/2022 |
| Next Release Date: NA |