|
Download Data (XLS File) |
|
|||||
|
|||||
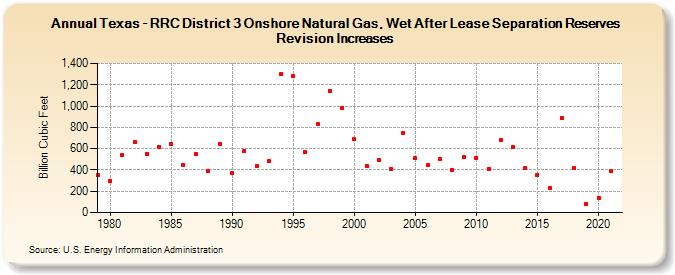
| Texas - RRC District 3 Onshore Natural Gas, Wet After Lease Separation Reserves Revision Increases (Billion Cubic Feet) | |||||
| Decade | Year-0 | Year-1 | Year-2 | Year-3 | Year-4 | Year-5 | Year-6 | Year-7 | Year-8 | Year-9 |
|---|---|---|---|---|---|---|---|---|---|---|
| 1970's | 355 | |||||||||
| 1980's | 300 | 542 | 661 | 548 | 617 | 640 | 444 | 550 | 391 | 643 |
| 1990's | 372 | 579 | 438 | 484 | 1,300 | 1,286 | 568 | 830 | 1,145 | 984 |
| 2000's | 687 | 441 | 491 | 406 | 751 | 510 | 442 | 503 | 400 | 525 |
| 2010's | 517 | 413 | 682 | 615 | 418 | 354 | 232 | 890 | 422 | 83 |
| 2020's | 140 | 392 |
| - = No Data Reported; -- = Not Applicable; NA = Not Available; W = Withheld to avoid disclosure of individual company data. |
| Release Date: 12/30/2022 |
| Next Release Date: NA |