|
Download Data (XLS File) |
|
|||||
|
|||||
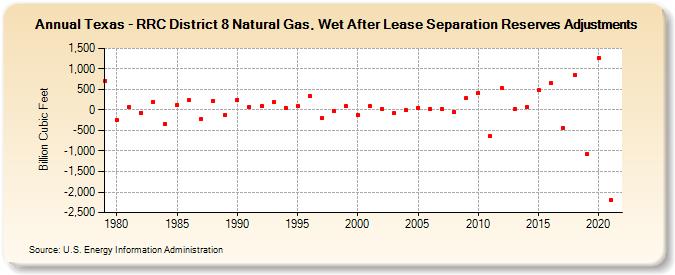
| Texas - RRC District 8 Natural Gas, Wet After Lease Separation Reserves Adjustments (Billion Cubic Feet) | |||||
| Decade | Year-0 | Year-1 | Year-2 | Year-3 | Year-4 | Year-5 | Year-6 | Year-7 | Year-8 | Year-9 |
|---|---|---|---|---|---|---|---|---|---|---|
| 1970's | 713 | |||||||||
| 1980's | -246 | 73 | -74 | 203 | -337 | 132 | 231 | -218 | 229 | -114 |
| 1990's | 251 | 80 | 93 | 189 | 49 | 97 | 342 | -194 | -15 | 89 |
| 2000's | -125 | 87 | 27 | -80 | -6 | 44 | 17 | 26 | -38 | 284 |
| 2010's | 407 | -631 | 523 | 21 | 67 | 478 | 651 | -434 | 862 | -1,084 |
| 2020's | 1,268 | -2,200 |
| - = No Data Reported; -- = Not Applicable; NA = Not Available; W = Withheld to avoid disclosure of individual company data. |
| Release Date: 12/30/2022 |
| Next Release Date: NA |