|
Download Data (XLS File) |
|
|||||
|
|||||
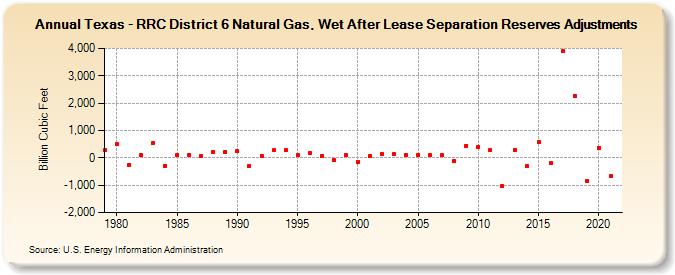
| Texas - RRC District 6 Natural Gas, Wet After Lease Separation Reserves Adjustments (Billion Cubic Feet) | |||||
| Decade | Year-0 | Year-1 | Year-2 | Year-3 | Year-4 | Year-5 | Year-6 | Year-7 | Year-8 | Year-9 |
|---|---|---|---|---|---|---|---|---|---|---|
| 1970's | 275 | |||||||||
| 1980's | 493 | -261 | 94 | 542 | -304 | 113 | 108 | 69 | 215 | 217 |
| 1990's | 233 | -296 | 62 | 272 | 283 | 111 | 166 | 73 | -73 | 102 |
| 2000's | -135 | 74 | 153 | 144 | 110 | 99 | 94 | 87 | -109 | 442 |
| 2010's | 413 | 271 | -1,034 | 269 | -310 | 566 | -205 | 3,889 | 2,274 | -851 |
| 2020's | 373 | -658 |
| - = No Data Reported; -- = Not Applicable; NA = Not Available; W = Withheld to avoid disclosure of individual company data. |
| Release Date: 12/30/2022 |
| Next Release Date: NA |