|
Download Data (XLS File) |
|
|||||
|
|||||
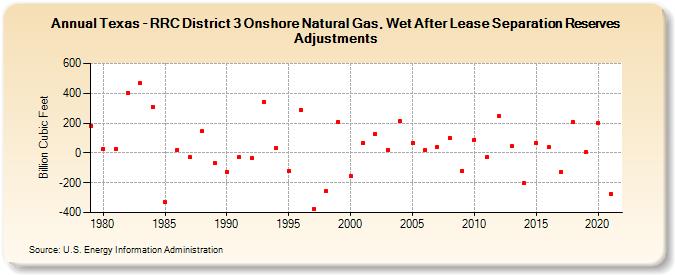
| Texas - RRC District 3 Onshore Natural Gas, Wet After Lease Separation Reserves Adjustments (Billion Cubic Feet) | |||||
| Decade | Year-0 | Year-1 | Year-2 | Year-3 | Year-4 | Year-5 | Year-6 | Year-7 | Year-8 | Year-9 |
|---|---|---|---|---|---|---|---|---|---|---|
| 1970's | 183 | |||||||||
| 1980's | 26 | 28 | 404 | 468 | 310 | -328 | 21 | -29 | 145 | -66 |
| 1990's | -127 | -28 | -34 | 344 | 32 | -120 | 290 | -375 | -256 | 210 |
| 2000's | -154 | 65 | 130 | 18 | 214 | 67 | 18 | 40 | 102 | -119 |
| 2010's | 90 | -28 | 245 | 46 | -204 | 67 | 37 | -128 | 205 | 4 |
| 2020's | 202 | -276 |
| - = No Data Reported; -- = Not Applicable; NA = Not Available; W = Withheld to avoid disclosure of individual company data. |
| Release Date: 12/30/2022 |
| Next Release Date: NA |