|
Download Data (XLS File) |
|
|||||
|
|||||
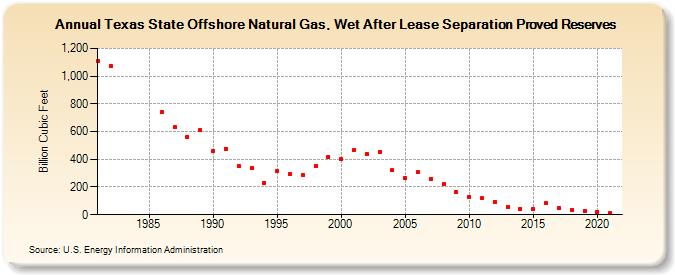
| Texas State Offshore Natural Gas, Wet After Lease Separation Proved Reserves (Billion Cubic Feet) | |||||
| Decade | Year-0 | Year-1 | Year-2 | Year-3 | Year-4 | Year-5 | Year-6 | Year-7 | Year-8 | Year-9 |
|---|---|---|---|---|---|---|---|---|---|---|
| 1980's | 1,112 | 1,073 | 739 | 634 | 564 | 610 | ||||
| 1990's | 461 | 477 | 350 | 337 | 230 | 313 | 293 | 290 | 350 | 419 |
| 2000's | 400 | 468 | 436 | 456 | 321 | 265 | 305 | 261 | 220 | 164 |
| 2010's | 131 | 118 | 94 | 59 | 42 | 40 | 83 | 47 | 33 | 27 |
| 2020's | 22 | 11 |
| - = No Data Reported; -- = Not Applicable; NA = Not Available; W = Withheld to avoid disclosure of individual company data. |
| Release Date: 12/30/2022 |
| Next Release Date: NA |