|
Download Data (XLS File) |
|
|||||
|
|||||
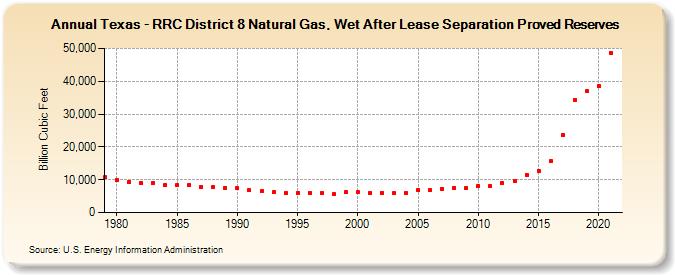
| Texas - RRC District 8 Natural Gas, Wet After Lease Separation Proved Reserves (Billion Cubic Feet) | |||||
| Decade | Year-0 | Year-1 | Year-2 | Year-3 | Year-4 | Year-5 | Year-6 | Year-7 | Year-8 | Year-9 |
|---|---|---|---|---|---|---|---|---|---|---|
| 1970's | 10,718 | |||||||||
| 1980's | 9,785 | 9,250 | 8,992 | 9,078 | 8,294 | 8,250 | 8,330 | 7,871 | 7,810 | 7,531 |
| 1990's | 7,391 | 6,793 | 6,534 | 6,131 | 6,018 | 6,052 | 6,050 | 6,030 | 5,547 | 6,122 |
| 2000's | 6,136 | 6,007 | 6,056 | 5,835 | 6,002 | 6,800 | 6,855 | 7,303 | 7,586 | 7,440 |
| 2010's | 8,105 | 8,088 | 8,963 | 9,715 | 11,575 | 12,674 | 15,632 | 23,632 | 34,391 | 36,879 |
| 2020's | 38,505 | 48,567 |
| - = No Data Reported; -- = Not Applicable; NA = Not Available; W = Withheld to avoid disclosure of individual company data. |
| Release Date: 12/30/2022 |
| Next Release Date: NA |