|
Download Data (XLS File) |
|
|||||
|
|||||
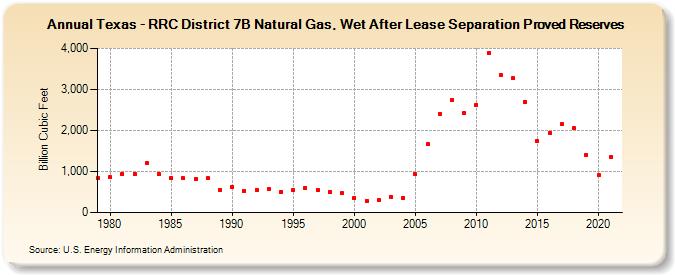
| Texas - RRC District 7B Natural Gas, Wet After Lease Separation Proved Reserves (Billion Cubic Feet) | |||||
| Decade | Year-0 | Year-1 | Year-2 | Year-3 | Year-4 | Year-5 | Year-6 | Year-7 | Year-8 | Year-9 |
|---|---|---|---|---|---|---|---|---|---|---|
| 1970's | 842 | |||||||||
| 1980's | 862 | 947 | 947 | 1,210 | 937 | 850 | 833 | 828 | 840 | 560 |
| 1990's | 627 | 536 | 550 | 580 | 513 | 539 | 610 | 559 | 510 | 465 |
| 2000's | 356 | 290 | 294 | 383 | 364 | 932 | 1,663 | 2,412 | 2,750 | 2,424 |
| 2010's | 2,625 | 3,887 | 3,363 | 3,267 | 2,695 | 1,735 | 1,945 | 2,148 | 2,049 | 1,411 |
| 2020's | 907 | 1,355 |
| - = No Data Reported; -- = Not Applicable; NA = Not Available; W = Withheld to avoid disclosure of individual company data. |
| Release Date: 12/30/2022 |
| Next Release Date: NA |