|
Download Data (XLS File) |
|
|||||
|
|||||
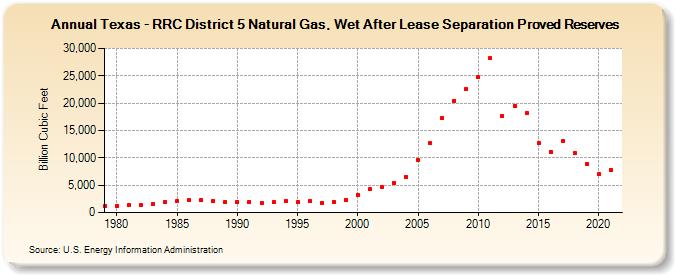
| Texas - RRC District 5 Natural Gas, Wet After Lease Separation Proved Reserves (Billion Cubic Feet) | |||||
| Decade | Year-0 | Year-1 | Year-2 | Year-3 | Year-4 | Year-5 | Year-6 | Year-7 | Year-8 | Year-9 |
|---|---|---|---|---|---|---|---|---|---|---|
| 1970's | 1,189 | |||||||||
| 1980's | 1,192 | 1,309 | 1,369 | 1,529 | 1,955 | 2,140 | 2,238 | 2,224 | 2,090 | 1,925 |
| 1990's | 1,951 | 1,930 | 1,818 | 1,931 | 2,074 | 1,923 | 2,141 | 1,749 | 1,995 | 2,350 |
| 2000's | 3,217 | 4,289 | 4,653 | 5,460 | 6,583 | 9,611 | 12,648 | 17,274 | 20,460 | 22,623 |
| 2010's | 24,694 | 28,187 | 17,640 | 19,531 | 18,155 | 12,637 | 11,154 | 12,988 | 10,878 | 8,831 |
| 2020's | 7,062 | 7,863 |
| - = No Data Reported; -- = Not Applicable; NA = Not Available; W = Withheld to avoid disclosure of individual company data. |
| Release Date: 12/30/2022 |
| Next Release Date: NA |