|
Download Data (XLS File) |
|
|||||
|
|||||
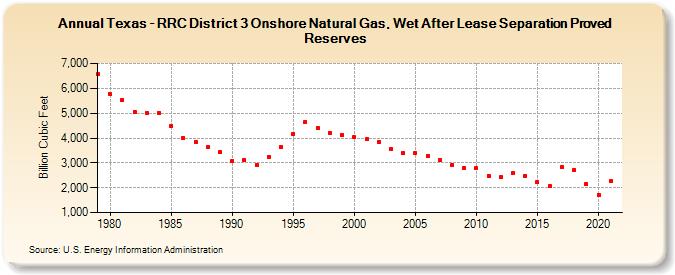
| Texas - RRC District 3 Onshore Natural Gas, Wet After Lease Separation Proved Reserves (Billion Cubic Feet) | |||||
| Decade | Year-0 | Year-1 | Year-2 | Year-3 | Year-4 | Year-5 | Year-6 | Year-7 | Year-8 | Year-9 |
|---|---|---|---|---|---|---|---|---|---|---|
| 1970's | 6,565 | |||||||||
| 1980's | 5,762 | 5,546 | 5,048 | 5,004 | 5,020 | 4,477 | 4,010 | 3,859 | 3,626 | 3,426 |
| 1990's | 3,080 | 3,110 | 2,929 | 3,251 | 3,653 | 4,156 | 4,652 | 4,418 | 4,205 | 4,132 |
| 2000's | 4,042 | 3,943 | 3,826 | 3,548 | 3,400 | 3,406 | 3,278 | 3,102 | 2,932 | 2,802 |
| 2010's | 2,774 | 2,490 | 2,429 | 2,592 | 2,483 | 2,211 | 2,052 | 2,832 | 2,732 | 2,147 |
| 2020's | 1,708 | 2,262 |
| - = No Data Reported; -- = Not Applicable; NA = Not Available; W = Withheld to avoid disclosure of individual company data. |
| Release Date: 12/30/2022 |
| Next Release Date: NA |