|
Download Data (XLS File) |
|
|||||
|
|||||
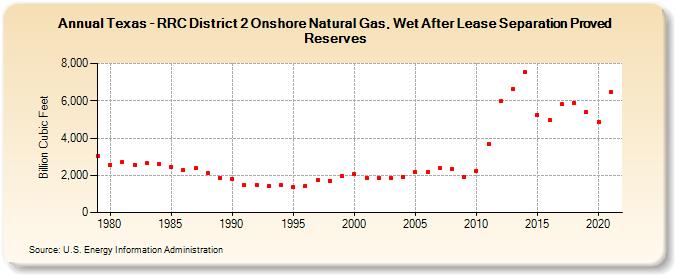
| Texas - RRC District 2 Onshore Natural Gas, Wet After Lease Separation Proved Reserves (Billion Cubic Feet) | |||||
| Decade | Year-0 | Year-1 | Year-2 | Year-3 | Year-4 | Year-5 | Year-6 | Year-7 | Year-8 | Year-9 |
|---|---|---|---|---|---|---|---|---|---|---|
| 1970's | 3,034 | |||||||||
| 1980's | 2,566 | 2,726 | 2,565 | 2,637 | 2,626 | 2,465 | 2,277 | 2,373 | 2,131 | 1,849 |
| 1990's | 1,825 | 1,479 | 1,484 | 1,425 | 1,468 | 1,371 | 1,430 | 1,732 | 1,720 | 1,974 |
| 2000's | 2,045 | 1,863 | 1,867 | 1,849 | 1,934 | 2,175 | 2,166 | 2,386 | 2,364 | 1,909 |
| 2010's | 2,235 | 3,690 | 5,985 | 6,640 | 7,524 | 5,249 | 4,965 | 5,804 | 5,853 | 5,406 |
| 2020's | 4,882 | 6,489 |
| - = No Data Reported; -- = Not Applicable; NA = Not Available; W = Withheld to avoid disclosure of individual company data. |
| Release Date: 12/30/2022 |
| Next Release Date: NA |