|
Download Data (XLS File) |
|
|||||
|
|||||
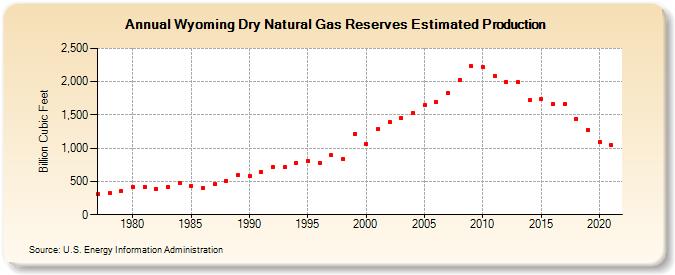
| Wyoming Dry Natural Gas Reserves Estimated Production (Billion Cubic Feet) | |||||
| Decade | Year-0 | Year-1 | Year-2 | Year-3 | Year-4 | Year-5 | Year-6 | Year-7 | Year-8 | Year-9 |
|---|---|---|---|---|---|---|---|---|---|---|
| 1970's | 315 | 329 | 355 | |||||||
| 1980's | 416 | 423 | 391 | 414 | 484 | 433 | 402 | 456 | 510 | 591 |
| 1990's | 583 | 639 | 714 | 713 | 780 | 806 | 782 | 891 | 838 | 1,213 |
| 2000's | 1,070 | 1,286 | 1,388 | 1,456 | 1,524 | 1,642 | 1,695 | 1,825 | 2,026 | 2,233 |
| 2010's | 2,218 | 2,088 | 2,001 | 1,992 | 1,718 | 1,734 | 1,665 | 1,658 | 1,436 | 1,279 |
| 2020's | 1,097 | 1,043 |
| - = No Data Reported; -- = Not Applicable; NA = Not Available; W = Withheld to avoid disclosure of individual company data. |
| Release Date: 12/30/2022 |
| Next Release Date: NA |