|
Download Data (XLS File) |
|
|||||
|
|||||
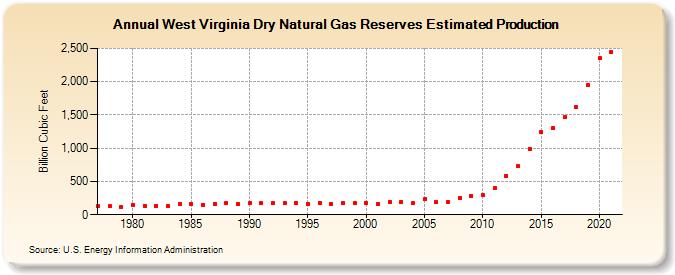
| West Virginia Dry Natural Gas Reserves Estimated Production (Billion Cubic Feet) | |||||
| Decade | Year-0 | Year-1 | Year-2 | Year-3 | Year-4 | Year-5 | Year-6 | Year-7 | Year-8 | Year-9 |
|---|---|---|---|---|---|---|---|---|---|---|
| 1970's | 124 | 126 | 116 | |||||||
| 1980's | 151 | 137 | 136 | 126 | 165 | 164 | 153 | 168 | 172 | 160 |
| 1990's | 169 | 176 | 170 | 169 | 172 | 166 | 177 | 167 | 170 | 173 |
| 2000's | 176 | 158 | 194 | 189 | 170 | 230 | 187 | 192 | 250 | 278 |
| 2010's | 293 | 395 | 588 | 728 | 985 | 1,238 | 1,303 | 1,464 | 1,612 | 1,950 |
| 2020's | 2,349 | 2,447 |
| - = No Data Reported; -- = Not Applicable; NA = Not Available; W = Withheld to avoid disclosure of individual company data. |
| Release Date: 12/30/2022 |
| Next Release Date: NA |