|
Download Data (XLS File) |
|
|||||
|
|||||
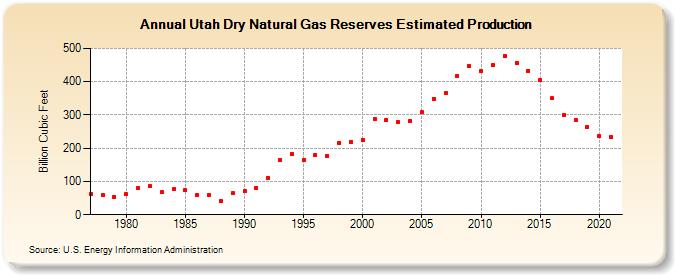
| Utah Dry Natural Gas Reserves Estimated Production (Billion Cubic Feet) | |||||
| Decade | Year-0 | Year-1 | Year-2 | Year-3 | Year-4 | Year-5 | Year-6 | Year-7 | Year-8 | Year-9 |
|---|---|---|---|---|---|---|---|---|---|---|
| 1970's | 62 | 58 | 54 | |||||||
| 1980's | 61 | 79 | 87 | 68 | 76 | 73 | 60 | 60 | 40 | 64 |
| 1990's | 71 | 81 | 111 | 165 | 184 | 165 | 180 | 177 | 216 | 220 |
| 2000's | 226 | 288 | 286 | 278 | 282 | 308 | 349 | 365 | 417 | 447 |
| 2010's | 432 | 449 | 478 | 456 | 433 | 405 | 350 | 301 | 286 | 265 |
| 2020's | 236 | 234 |
| - = No Data Reported; -- = Not Applicable; NA = Not Available; W = Withheld to avoid disclosure of individual company data. |
| Release Date: 12/30/2022 |
| Next Release Date: NA |