|
Download Data (XLS File) |
|
|||||
|
|||||
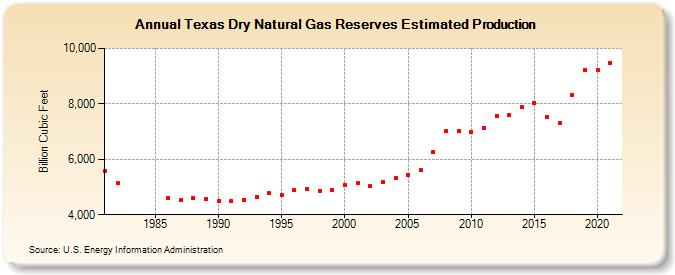
| Texas Dry Natural Gas Reserves Estimated Production (Billion Cubic Feet) | |||||
| Decade | Year-0 | Year-1 | Year-2 | Year-3 | Year-4 | Year-5 | Year-6 | Year-7 | Year-8 | Year-9 |
|---|---|---|---|---|---|---|---|---|---|---|
| 1980's | 5,567 | 5,151 | 4,620 | 4,517 | 4,590 | 4,568 | ||||
| 1990's | 4,478 | 4,480 | 4,545 | 4,645 | 4,775 | 4,724 | 4,889 | 4,942 | 4,855 | 4,897 |
| 2000's | 5,072 | 5,138 | 5,038 | 5,166 | 5,318 | 5,424 | 5,608 | 6,263 | 7,009 | 7,017 |
| 2010's | 6,974 | 7,139 | 7,570 | 7,607 | 7,877 | 8,031 | 7,514 | 7,324 | 8,314 | 9,217 |
| 2020's | 9,223 | 9,486 |
| - = No Data Reported; -- = Not Applicable; NA = Not Available; W = Withheld to avoid disclosure of individual company data. |
| Release Date: 12/30/2022 |
| Next Release Date: NA |