|
Download Data (XLS File) |
|
|||||
|
|||||
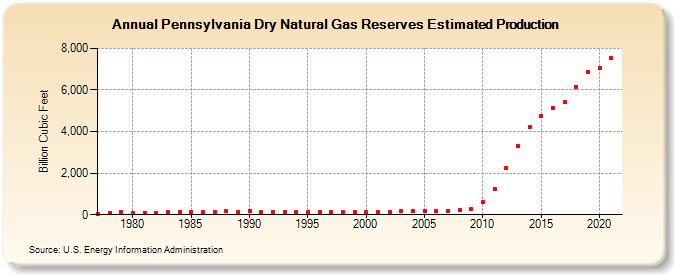
| Pennsylvania Dry Natural Gas Reserves Estimated Production (Billion Cubic Feet) | |||||
| Decade | Year-0 | Year-1 | Year-2 | Year-3 | Year-4 | Year-5 | Year-6 | Year-7 | Year-8 | Year-9 |
|---|---|---|---|---|---|---|---|---|---|---|
| 1970's | 52 | 69 | 117 | |||||||
| 1980's | 68 | 94 | 102 | 121 | 134 | 123 | 116 | 128 | 162 | 136 |
| 1990's | 160 | 140 | 139 | 138 | 141 | 113 | 132 | 129 | 131 | 130 |
| 2000's | 117 | 114 | 133 | 165 | 155 | 181 | 176 | 183 | 211 | 273 |
| 2010's | 591 | 1,248 | 2,241 | 3,283 | 4,197 | 4,753 | 5,136 | 5,399 | 6,122 | 6,865 |
| 2020's | 7,056 | 7,541 |
| - = No Data Reported; -- = Not Applicable; NA = Not Available; W = Withheld to avoid disclosure of individual company data. |
| Release Date: 12/30/2022 |
| Next Release Date: NA |