|
Download Data (XLS File) |
|
|||||
|
|||||
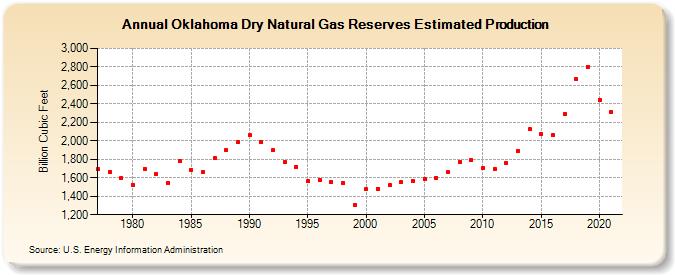
| Oklahoma Dry Natural Gas Reserves Estimated Production (Billion Cubic Feet) | |||||
| Decade | Year-0 | Year-1 | Year-2 | Year-3 | Year-4 | Year-5 | Year-6 | Year-7 | Year-8 | Year-9 |
|---|---|---|---|---|---|---|---|---|---|---|
| 1970's | 1,691 | 1,667 | 1,592 | |||||||
| 1980's | 1,526 | 1,700 | 1,636 | 1,544 | 1,778 | 1,686 | 1,658 | 1,813 | 1,896 | 1,983 |
| 1990's | 2,058 | 1,983 | 1,895 | 1,770 | 1,721 | 1,562 | 1,580 | 1,555 | 1,544 | 1,308 |
| 2000's | 1,473 | 1,481 | 1,518 | 1,554 | 1,563 | 1,587 | 1,601 | 1,659 | 1,775 | 1,790 |
| 2010's | 1,703 | 1,697 | 1,763 | 1,890 | 2,123 | 2,071 | 2,061 | 2,289 | 2,666 | 2,803 |
| 2020's | 2,446 | 2,310 |
| - = No Data Reported; -- = Not Applicable; NA = Not Available; W = Withheld to avoid disclosure of individual company data. |
| Release Date: 12/30/2022 |
| Next Release Date: NA |