|
Download Data (XLS File) |
|
|||||
|
|||||
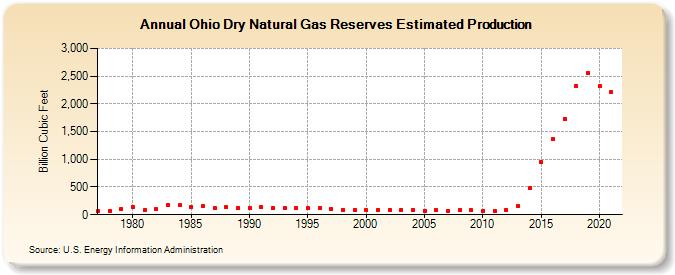
| Ohio Dry Natural Gas Reserves Estimated Production (Billion Cubic Feet) | |||||
| Decade | Year-0 | Year-1 | Year-2 | Year-3 | Year-4 | Year-5 | Year-6 | Year-7 | Year-8 | Year-9 |
|---|---|---|---|---|---|---|---|---|---|---|
| 1970's | 60 | 65 | 105 | |||||||
| 1980's | 137 | 85 | 99 | 179 | 169 | 140 | 149 | 117 | 132 | 130 |
| 1990's | 127 | 132 | 117 | 121 | 119 | 115 | 121 | 105 | 94 | 94 |
| 2000's | 79 | 84 | 87 | 82 | 82 | 76 | 78 | 71 | 79 | 79 |
| 2010's | 73 | 76 | 85 | 166 | 477 | 945 | 1,363 | 1,734 | 2,318 | 2,558 |
| 2020's | 2,313 | 2,206 |
| - = No Data Reported; -- = Not Applicable; NA = Not Available; W = Withheld to avoid disclosure of individual company data. |
| Release Date: 12/30/2022 |
| Next Release Date: NA |