|
Download Data (XLS File) |
|
|||||
|
|||||
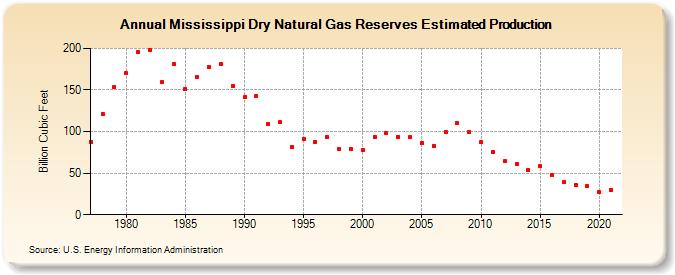
| Mississippi Dry Natural Gas Reserves Estimated Production (Billion Cubic Feet) | |||||
| Decade | Year-0 | Year-1 | Year-2 | Year-3 | Year-4 | Year-5 | Year-6 | Year-7 | Year-8 | Year-9 |
|---|---|---|---|---|---|---|---|---|---|---|
| 1970's | 88 | 121 | 154 | |||||||
| 1980's | 170 | 196 | 198 | 159 | 181 | 151 | 165 | 178 | 181 | 155 |
| 1990's | 141 | 143 | 109 | 111 | 82 | 91 | 88 | 93 | 79 | 79 |
| 2000's | 78 | 94 | 98 | 94 | 93 | 86 | 83 | 100 | 110 | 100 |
| 2010's | 87 | 75 | 64 | 61 | 54 | 58 | 48 | 39 | 36 | 34 |
| 2020's | 27 | 30 |
| - = No Data Reported; -- = Not Applicable; NA = Not Available; W = Withheld to avoid disclosure of individual company data. |
| Release Date: 12/30/2022 |
| Next Release Date: NA |