|
Download Data (XLS File) |
|
|||||
|
|||||
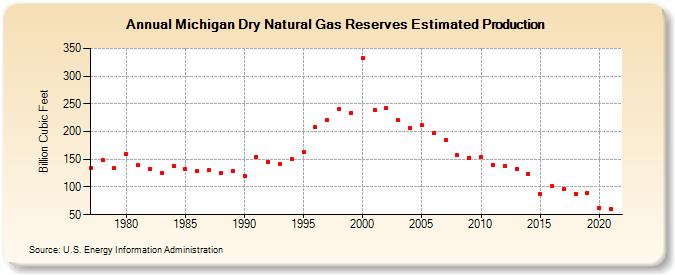
| Michigan Dry Natural Gas Reserves Estimated Production (Billion Cubic Feet) | |||||
| Decade | Year-0 | Year-1 | Year-2 | Year-3 | Year-4 | Year-5 | Year-6 | Year-7 | Year-8 | Year-9 |
|---|---|---|---|---|---|---|---|---|---|---|
| 1970's | 135 | 149 | 134 | |||||||
| 1980's | 160 | 139 | 133 | 125 | 138 | 132 | 128 | 130 | 126 | 129 |
| 1990's | 120 | 155 | 145 | 141 | 150 | 163 | 208 | 221 | 240 | 234 |
| 2000's | 333 | 239 | 242 | 220 | 207 | 211 | 197 | 184 | 157 | 153 |
| 2010's | 154 | 139 | 138 | 133 | 124 | 87 | 101 | 96 | 88 | 89 |
| 2020's | 63 | 60 |
| - = No Data Reported; -- = Not Applicable; NA = Not Available; W = Withheld to avoid disclosure of individual company data. |
| Release Date: 12/30/2022 |
| Next Release Date: NA |