|
Download Data (XLS File) |
|
|||||
|
|||||
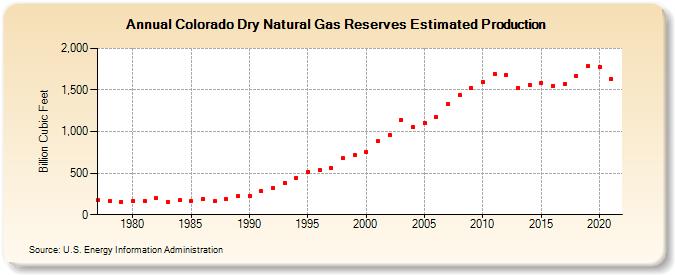
| Colorado Dry Natural Gas Reserves Estimated Production (Billion Cubic Feet) | |||||
| Decade | Year-0 | Year-1 | Year-2 | Year-3 | Year-4 | Year-5 | Year-6 | Year-7 | Year-8 | Year-9 |
|---|---|---|---|---|---|---|---|---|---|---|
| 1970's | 174 | 167 | 156 | |||||||
| 1980's | 163 | 165 | 196 | 156 | 171 | 166 | 188 | 159 | 188 | 220 |
| 1990's | 229 | 282 | 320 | 387 | 447 | 514 | 540 | 562 | 676 | 719 |
| 2000's | 759 | 882 | 964 | 1,142 | 1,050 | 1,104 | 1,174 | 1,326 | 1,441 | 1,524 |
| 2010's | 1,590 | 1,694 | 1,681 | 1,527 | 1,561 | 1,582 | 1,551 | 1,572 | 1,670 | 1,785 |
| 2020's | 1,776 | 1,630 |
| - = No Data Reported; -- = Not Applicable; NA = Not Available; W = Withheld to avoid disclosure of individual company data. |
| Release Date: 12/30/2022 |
| Next Release Date: NA |