|
Download Data (XLS File) |
|
|||||
|
|||||
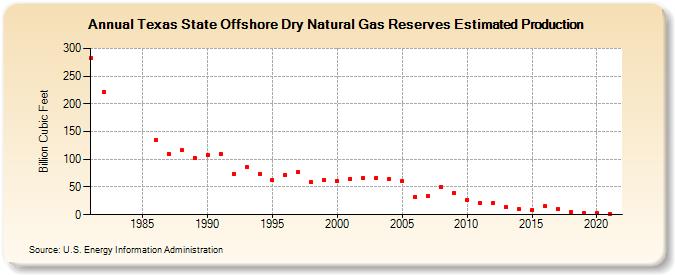
| Texas State Offshore Dry Natural Gas Reserves Estimated Production (Billion Cubic Feet) | |||||
| Decade | Year-0 | Year-1 | Year-2 | Year-3 | Year-4 | Year-5 | Year-6 | Year-7 | Year-8 | Year-9 |
|---|---|---|---|---|---|---|---|---|---|---|
| 1980's | 282 | 222 | 134 | 110 | 116 | 103 | ||||
| 1990's | 108 | 110 | 74 | 86 | 73 | 62 | 72 | 77 | 59 | 63 |
| 2000's | 60 | 65 | 67 | 67 | 65 | 60 | 32 | 33 | 50 | 40 |
| 2010's | 27 | 21 | 22 | 14 | 10 | 8 | 15 | 10 | 5 | 3 |
| 2020's | 3 | 2 |
| - = No Data Reported; -- = Not Applicable; NA = Not Available; W = Withheld to avoid disclosure of individual company data. |
| Release Date: 12/30/2022 |
| Next Release Date: NA |