|
Download Data (XLS File) |
|
|||||
|
|||||
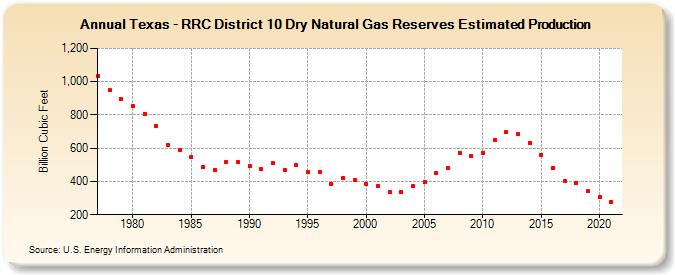
| Texas - RRC District 10 Dry Natural Gas Reserves Estimated Production (Billion Cubic Feet) | |||||
| Decade | Year-0 | Year-1 | Year-2 | Year-3 | Year-4 | Year-5 | Year-6 | Year-7 | Year-8 | Year-9 |
|---|---|---|---|---|---|---|---|---|---|---|
| 1970's | 1,033 | 948 | 896 | |||||||
| 1980's | 854 | 808 | 734 | 621 | 587 | 549 | 489 | 471 | 515 | 515 |
| 1990's | 492 | 472 | 509 | 470 | 500 | 455 | 457 | 387 | 418 | 408 |
| 2000's | 386 | 373 | 337 | 338 | 375 | 398 | 450 | 482 | 574 | 553 |
| 2010's | 569 | 650 | 698 | 686 | 632 | 561 | 483 | 400 | 393 | 340 |
| 2020's | 306 | 277 |
| - = No Data Reported; -- = Not Applicable; NA = Not Available; W = Withheld to avoid disclosure of individual company data. |
| Release Date: 12/30/2022 |
| Next Release Date: NA |