|
Download Data (XLS File) |
|
|||||
|
|||||
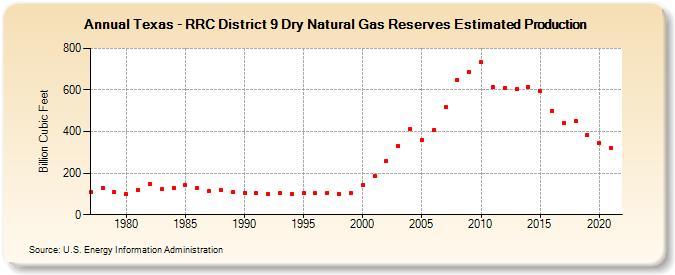
| Texas - RRC District 9 Dry Natural Gas Reserves Estimated Production (Billion Cubic Feet) | |||||
| Decade | Year-0 | Year-1 | Year-2 | Year-3 | Year-4 | Year-5 | Year-6 | Year-7 | Year-8 | Year-9 |
|---|---|---|---|---|---|---|---|---|---|---|
| 1970's | 108 | 130 | 108 | |||||||
| 1980's | 99 | 119 | 149 | 122 | 130 | 141 | 128 | 112 | 117 | 107 |
| 1990's | 106 | 104 | 99 | 104 | 100 | 103 | 104 | 106 | 101 | 104 |
| 2000's | 144 | 185 | 258 | 332 | 412 | 361 | 407 | 519 | 650 | 687 |
| 2010's | 733 | 613 | 611 | 603 | 616 | 593 | 500 | 443 | 450 | 382 |
| 2020's | 345 | 322 |
| - = No Data Reported; -- = Not Applicable; NA = Not Available; W = Withheld to avoid disclosure of individual company data. |
| Release Date: 12/30/2022 |
| Next Release Date: NA |