|
Download Data (XLS File) |
|
|||||
|
|||||
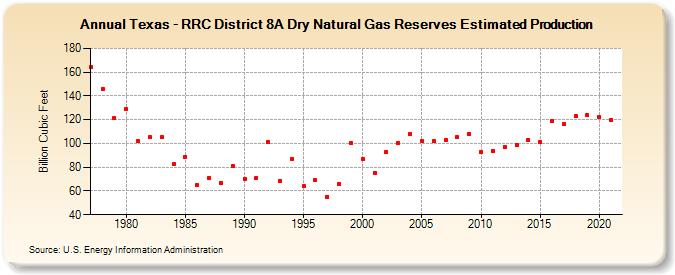
| Texas - RRC District 8A Dry Natural Gas Reserves Estimated Production (Billion Cubic Feet) | |||||
| Decade | Year-0 | Year-1 | Year-2 | Year-3 | Year-4 | Year-5 | Year-6 | Year-7 | Year-8 | Year-9 |
|---|---|---|---|---|---|---|---|---|---|---|
| 1970's | 164 | 146 | 121 | |||||||
| 1980's | 129 | 102 | 105 | 105 | 83 | 89 | 65 | 71 | 67 | 81 |
| 1990's | 70 | 71 | 101 | 68 | 87 | 64 | 69 | 55 | 66 | 100 |
| 2000's | 87 | 75 | 93 | 100 | 108 | 102 | 102 | 103 | 105 | 108 |
| 2010's | 93 | 94 | 97 | 99 | 103 | 101 | 119 | 116 | 123 | 124 |
| 2020's | 122 | 120 |
| - = No Data Reported; -- = Not Applicable; NA = Not Available; W = Withheld to avoid disclosure of individual company data. |
| Release Date: 12/30/2022 |
| Next Release Date: NA |