|
Download Data (XLS File) |
|
|||||
|
|||||
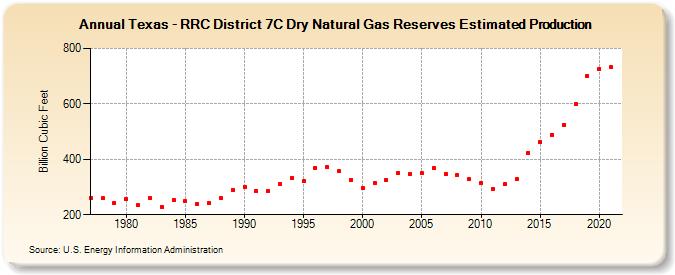
| Texas - RRC District 7C Dry Natural Gas Reserves Estimated Production (Billion Cubic Feet) | |||||
| Decade | Year-0 | Year-1 | Year-2 | Year-3 | Year-4 | Year-5 | Year-6 | Year-7 | Year-8 | Year-9 |
|---|---|---|---|---|---|---|---|---|---|---|
| 1970's | 261 | 259 | 243 | |||||||
| 1980's | 256 | 234 | 261 | 228 | 254 | 248 | 238 | 242 | 259 | 290 |
| 1990's | 301 | 285 | 285 | 309 | 334 | 321 | 370 | 372 | 356 | 327 |
| 2000's | 296 | 315 | 327 | 350 | 348 | 349 | 369 | 346 | 342 | 328 |
| 2010's | 315 | 293 | 309 | 328 | 424 | 462 | 489 | 525 | 599 | 701 |
| 2020's | 725 | 732 |
| - = No Data Reported; -- = Not Applicable; NA = Not Available; W = Withheld to avoid disclosure of individual company data. |
| Release Date: 12/30/2022 |
| Next Release Date: NA |