|
Download Data (XLS File) |
|
|||||
|
|||||
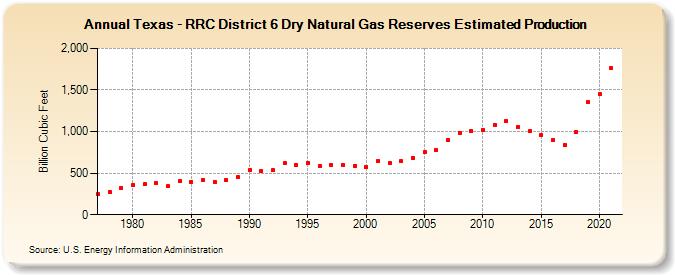
| Texas - RRC District 6 Dry Natural Gas Reserves Estimated Production (Billion Cubic Feet) | |||||
| Decade | Year-0 | Year-1 | Year-2 | Year-3 | Year-4 | Year-5 | Year-6 | Year-7 | Year-8 | Year-9 |
|---|---|---|---|---|---|---|---|---|---|---|
| 1970's | 252 | 275 | 321 | |||||||
| 1980's | 352 | 365 | 381 | 341 | 402 | 396 | 415 | 395 | 416 | 453 |
| 1990's | 534 | 522 | 532 | 619 | 596 | 620 | 583 | 599 | 594 | 591 |
| 2000's | 575 | 644 | 624 | 642 | 683 | 752 | 774 | 896 | 983 | 1,004 |
| 2010's | 1,017 | 1,079 | 1,124 | 1,057 | 1,002 | 963 | 897 | 839 | 992 | 1,352 |
| 2020's | 1,453 | 1,759 |
| - = No Data Reported; -- = Not Applicable; NA = Not Available; W = Withheld to avoid disclosure of individual company data. |
| Release Date: 12/30/2022 |
| Next Release Date: NA |