|
Download Data (XLS File) |
|
|||||
|
|||||
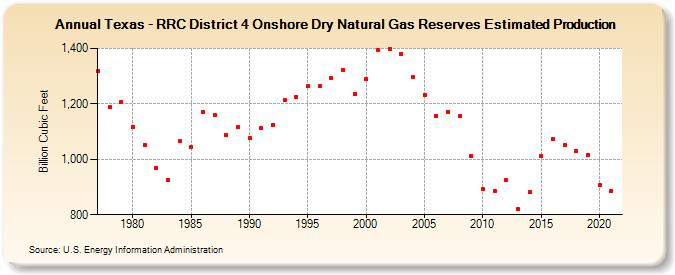
| Texas - RRC District 4 Onshore Dry Natural Gas Reserves Estimated Production (Billion Cubic Feet) | |||||
| Decade | Year-0 | Year-1 | Year-2 | Year-3 | Year-4 | Year-5 | Year-6 | Year-7 | Year-8 | Year-9 |
|---|---|---|---|---|---|---|---|---|---|---|
| 1970's | 1,319 | 1,188 | 1,208 | |||||||
| 1980's | 1,117 | 1,053 | 969 | 926 | 1,065 | 1,044 | 1,169 | 1,158 | 1,089 | 1,117 |
| 1990's | 1,075 | 1,114 | 1,124 | 1,213 | 1,226 | 1,264 | 1,263 | 1,292 | 1,323 | 1,236 |
| 2000's | 1,289 | 1,395 | 1,398 | 1,381 | 1,295 | 1,232 | 1,157 | 1,172 | 1,156 | 1,013 |
| 2010's | 893 | 886 | 926 | 819 | 882 | 1,011 | 1,074 | 1,052 | 1,029 | 1,016 |
| 2020's | 906 | 884 |
| - = No Data Reported; -- = Not Applicable; NA = Not Available; W = Withheld to avoid disclosure of individual company data. |
| Release Date: 12/30/2022 |
| Next Release Date: NA |