|
Download Data (XLS File) |
|
|||||
|
|||||
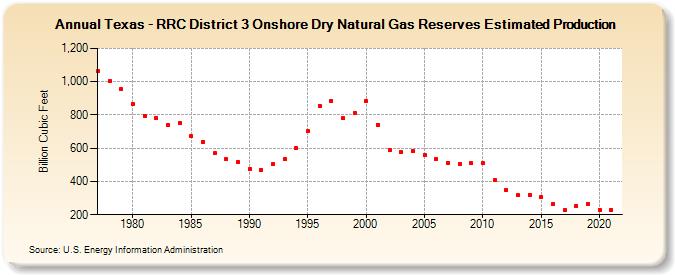
| Texas - RRC District 3 Onshore Dry Natural Gas Reserves Estimated Production (Billion Cubic Feet) | |||||
| Decade | Year-0 | Year-1 | Year-2 | Year-3 | Year-4 | Year-5 | Year-6 | Year-7 | Year-8 | Year-9 |
|---|---|---|---|---|---|---|---|---|---|---|
| 1970's | 1,063 | 1,003 | 955 | |||||||
| 1980's | 865 | 796 | 782 | 740 | 752 | 673 | 639 | 569 | 533 | 517 |
| 1990's | 474 | 470 | 502 | 532 | 600 | 701 | 856 | 886 | 781 | 813 |
| 2000's | 883 | 741 | 588 | 576 | 582 | 558 | 532 | 512 | 505 | 509 |
| 2010's | 508 | 409 | 350 | 317 | 321 | 307 | 263 | 226 | 253 | 264 |
| 2020's | 229 | 229 |
| - = No Data Reported; -- = Not Applicable; NA = Not Available; W = Withheld to avoid disclosure of individual company data. |
| Release Date: 12/30/2022 |
| Next Release Date: NA |