|
Download Data (XLS File) |
|
|||||
|
|||||
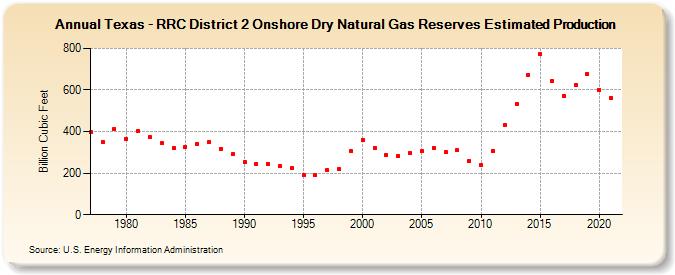
| Texas - RRC District 2 Onshore Dry Natural Gas Reserves Estimated Production (Billion Cubic Feet) | |||||
| Decade | Year-0 | Year-1 | Year-2 | Year-3 | Year-4 | Year-5 | Year-6 | Year-7 | Year-8 | Year-9 |
|---|---|---|---|---|---|---|---|---|---|---|
| 1970's | 396 | 349 | 413 | |||||||
| 1980's | 366 | 404 | 374 | 343 | 320 | 328 | 341 | 349 | 318 | 291 |
| 1990's | 254 | 244 | 246 | 232 | 224 | 189 | 190 | 214 | 219 | 306 |
| 2000's | 361 | 322 | 288 | 282 | 296 | 305 | 323 | 301 | 310 | 259 |
| 2010's | 237 | 306 | 430 | 534 | 673 | 773 | 644 | 573 | 625 | 679 |
| 2020's | 602 | 563 |
| - = No Data Reported; -- = Not Applicable; NA = Not Available; W = Withheld to avoid disclosure of individual company data. |
| Release Date: 12/30/2022 |
| Next Release Date: NA |