|
Download Data (XLS File) |
|
|||||
|
|||||
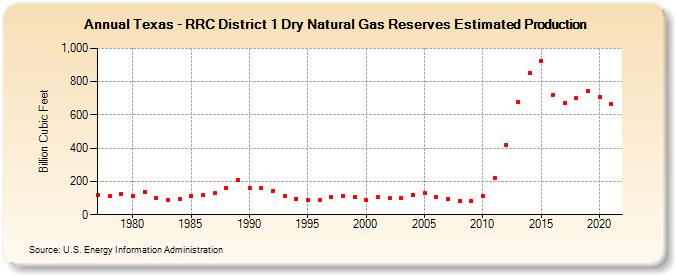
| Texas - RRC District 1 Dry Natural Gas Reserves Estimated Production (Billion Cubic Feet) | |||||
| Decade | Year-0 | Year-1 | Year-2 | Year-3 | Year-4 | Year-5 | Year-6 | Year-7 | Year-8 | Year-9 |
|---|---|---|---|---|---|---|---|---|---|---|
| 1970's | 119 | 110 | 124 | |||||||
| 1980's | 112 | 139 | 100 | 87 | 94 | 114 | 116 | 130 | 161 | 206 |
| 1990's | 161 | 159 | 141 | 112 | 97 | 89 | 86 | 105 | 113 | 107 |
| 2000's | 86 | 104 | 98 | 100 | 120 | 128 | 109 | 92 | 85 | 82 |
| 2010's | 113 | 218 | 422 | 678 | 854 | 925 | 719 | 674 | 703 | 745 |
| 2020's | 706 | 664 |
| - = No Data Reported; -- = Not Applicable; NA = Not Available; W = Withheld to avoid disclosure of individual company data. |
| Release Date: 12/30/2022 |
| Next Release Date: NA |