|
Download Data (XLS File) |
|
|||||
|
|||||
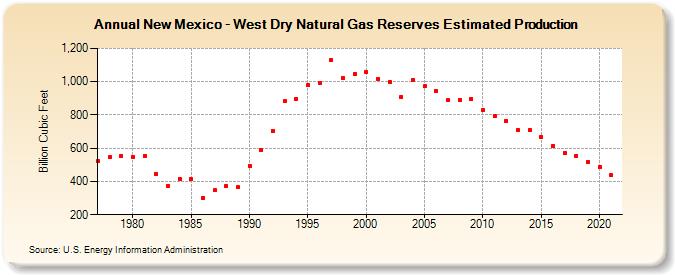
| New Mexico - West Dry Natural Gas Reserves Estimated Production (Billion Cubic Feet) | |||||
| Decade | Year-0 | Year-1 | Year-2 | Year-3 | Year-4 | Year-5 | Year-6 | Year-7 | Year-8 | Year-9 |
|---|---|---|---|---|---|---|---|---|---|---|
| 1970's | 523 | 546 | 553 | |||||||
| 1980's | 549 | 555 | 444 | 375 | 417 | 414 | 303 | 346 | 372 | 364 |
| 1990's | 495 | 589 | 706 | 881 | 896 | 979 | 991 | 1,129 | 1,022 | 1,048 |
| 2000's | 1,061 | 1,018 | 998 | 908 | 1,011 | 971 | 946 | 887 | 890 | 896 |
| 2010's | 828 | 793 | 765 | 708 | 710 | 669 | 616 | 572 | 555 | 517 |
| 2020's | 486 | 437 |
| - = No Data Reported; -- = Not Applicable; NA = Not Available; W = Withheld to avoid disclosure of individual company data. |
| Release Date: 12/30/2022 |
| Next Release Date: NA |