|
Download Data (XLS File) |
|
|||||
|
|||||
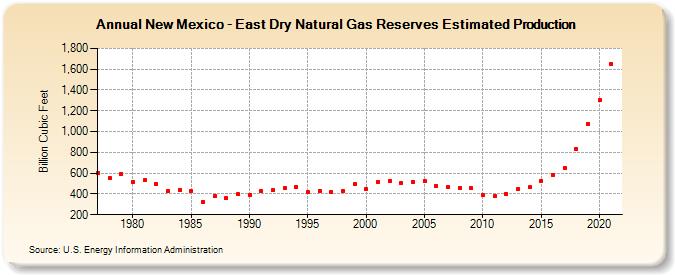
| New Mexico - East Dry Natural Gas Reserves Estimated Production (Billion Cubic Feet) | |||||
| Decade | Year-0 | Year-1 | Year-2 | Year-3 | Year-4 | Year-5 | Year-6 | Year-7 | Year-8 | Year-9 |
|---|---|---|---|---|---|---|---|---|---|---|
| 1970's | 604 | 553 | 596 | |||||||
| 1980's | 515 | 531 | 498 | 424 | 439 | 429 | 325 | 382 | 359 | 396 |
| 1990's | 392 | 424 | 437 | 456 | 466 | 418 | 432 | 418 | 427 | 491 |
| 2000's | 447 | 518 | 526 | 507 | 516 | 522 | 480 | 462 | 459 | 454 |
| 2010's | 392 | 377 | 404 | 447 | 464 | 528 | 586 | 651 | 832 | 1,072 |
| 2020's | 1,299 | 1,651 |
| - = No Data Reported; -- = Not Applicable; NA = Not Available; W = Withheld to avoid disclosure of individual company data. |
| Release Date: 12/30/2022 |
| Next Release Date: NA |