|
Download Data (XLS File) |
|
|||||
|
|||||
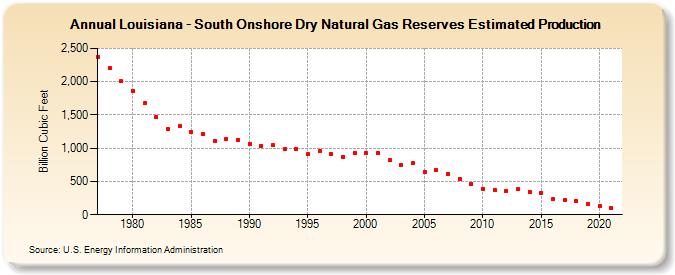
| Louisiana - South Onshore Dry Natural Gas Reserves Estimated Production (Billion Cubic Feet) | |||||
| Decade | Year-0 | Year-1 | Year-2 | Year-3 | Year-4 | Year-5 | Year-6 | Year-7 | Year-8 | Year-9 |
|---|---|---|---|---|---|---|---|---|---|---|
| 1970's | 2,367 | 2,203 | 2,005 | |||||||
| 1980's | 1,860 | 1,673 | 1,472 | 1,293 | 1,327 | 1,243 | 1,219 | 1,109 | 1,142 | 1,130 |
| 1990's | 1,070 | 1,034 | 1,043 | 993 | 981 | 908 | 957 | 911 | 875 | 927 |
| 2000's | 932 | 931 | 821 | 753 | 770 | 640 | 674 | 618 | 539 | 469 |
| 2010's | 394 | 373 | 359 | 379 | 347 | 331 | 229 | 224 | 205 | 154 |
| 2020's | 137 | 105 |
| - = No Data Reported; -- = Not Applicable; NA = Not Available; W = Withheld to avoid disclosure of individual company data. |
| Release Date: 12/30/2022 |
| Next Release Date: NA |