|
Download Data (XLS File) |
|
|||||
|
|||||
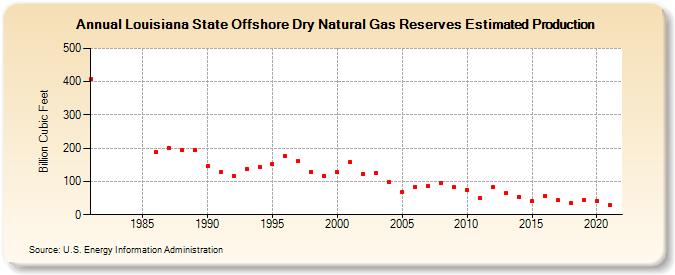
| Louisiana State Offshore Dry Natural Gas Reserves Estimated Production (Billion Cubic Feet) | |||||
| Decade | Year-0 | Year-1 | Year-2 | Year-3 | Year-4 | Year-5 | Year-6 | Year-7 | Year-8 | Year-9 |
|---|---|---|---|---|---|---|---|---|---|---|
| 1980's | 407 | 188 | 200 | 196 | 195 | |||||
| 1990's | 145 | 127 | 117 | 137 | 144 | 152 | 177 | 161 | 128 | 117 |
| 2000's | 127 | 158 | 122 | 126 | 99 | 68 | 83 | 86 | 95 | 83 |
| 2010's | 74 | 49 | 84 | 66 | 52 | 40 | 56 | 43 | 35 | 45 |
| 2020's | 41 | 28 |
| - = No Data Reported; -- = Not Applicable; NA = Not Available; W = Withheld to avoid disclosure of individual company data. |
| Release Date: 12/30/2022 |
| Next Release Date: NA |