|
Download Data (XLS File) |
|
|||||
|
|||||
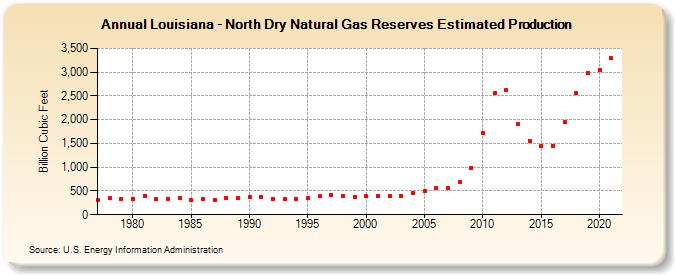
| Louisiana - North Dry Natural Gas Reserves Estimated Production (Billion Cubic Feet) | |||||
| Decade | Year-0 | Year-1 | Year-2 | Year-3 | Year-4 | Year-5 | Year-6 | Year-7 | Year-8 | Year-9 |
|---|---|---|---|---|---|---|---|---|---|---|
| 1970's | 317 | 344 | 335 | |||||||
| 1980's | 338 | 402 | 336 | 335 | 362 | 311 | 334 | 316 | 353 | 362 |
| 1990's | 381 | 366 | 334 | 327 | 328 | 343 | 387 | 424 | 400 | 377 |
| 2000's | 384 | 390 | 395 | 401 | 453 | 498 | 552 | 553 | 685 | 992 |
| 2010's | 1,721 | 2,563 | 2,614 | 1,899 | 1,561 | 1,436 | 1,455 | 1,950 | 2,552 | 2,992 |
| 2020's | 3,045 | 3,298 |
| - = No Data Reported; -- = Not Applicable; NA = Not Available; W = Withheld to avoid disclosure of individual company data. |
| Release Date: 12/30/2022 |
| Next Release Date: NA |