|
Download Data (XLS File) |
|
|||||
|
|||||
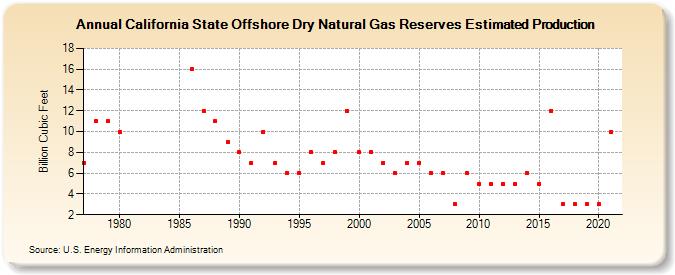
| California State Offshore Dry Natural Gas Reserves Estimated Production (Billion Cubic Feet) | |||||
| Decade | Year-0 | Year-1 | Year-2 | Year-3 | Year-4 | Year-5 | Year-6 | Year-7 | Year-8 | Year-9 |
|---|---|---|---|---|---|---|---|---|---|---|
| 1970's | 7 | 11 | 11 | |||||||
| 1980's | 10 | 16 | 12 | 11 | 9 | |||||
| 1990's | 8 | 7 | 10 | 7 | 6 | 6 | 8 | 7 | 8 | 12 |
| 2000's | 8 | 8 | 7 | 6 | 7 | 7 | 6 | 6 | 3 | 6 |
| 2010's | 5 | 5 | 5 | 5 | 6 | 5 | 12 | 3 | 3 | 3 |
| 2020's | 3 | 10 |
| - = No Data Reported; -- = Not Applicable; NA = Not Available; W = Withheld to avoid disclosure of individual company data. |
| Release Date: 12/30/2022 |
| Next Release Date: NA |