|
Download Data (XLS File) |
|
|||||
|
|||||
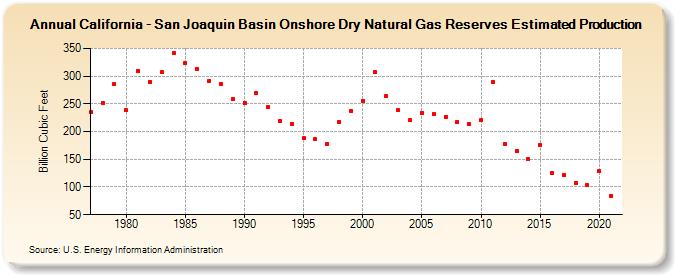
| California - San Joaquin Basin Onshore Dry Natural Gas Reserves Estimated Production (Billion Cubic Feet) | |||||
| Decade | Year-0 | Year-1 | Year-2 | Year-3 | Year-4 | Year-5 | Year-6 | Year-7 | Year-8 | Year-9 |
|---|---|---|---|---|---|---|---|---|---|---|
| 1970's | 235 | 252 | 285 | |||||||
| 1980's | 238 | 310 | 290 | 307 | 342 | 323 | 313 | 292 | 286 | 259 |
| 1990's | 252 | 270 | 245 | 219 | 213 | 188 | 186 | 178 | 217 | 237 |
| 2000's | 256 | 307 | 264 | 238 | 220 | 234 | 232 | 227 | 217 | 214 |
| 2010's | 220 | 289 | 178 | 165 | 150 | 176 | 126 | 122 | 108 | 103 |
| 2020's | 128 | 84 |
| - = No Data Reported; -- = Not Applicable; NA = Not Available; W = Withheld to avoid disclosure of individual company data. |
| Release Date: 12/30/2022 |
| Next Release Date: NA |