|
Download Data (XLS File) |
|
|||||
|
|||||
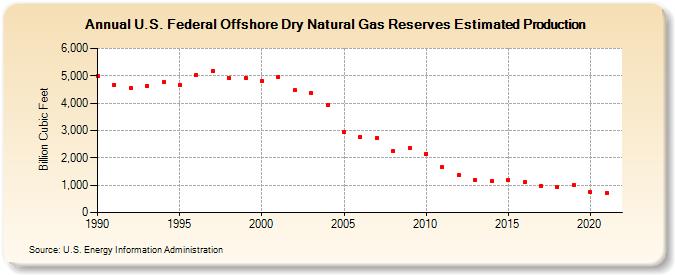
| U.S. Federal Offshore Dry Natural Gas Reserves Estimated Production (Billion Cubic Feet) | |||||
| Decade | Year-0 | Year-1 | Year-2 | Year-3 | Year-4 | Year-5 | Year-6 | Year-7 | Year-8 | Year-9 |
|---|---|---|---|---|---|---|---|---|---|---|
| 1990's | 4,984 | 4,674 | 4,556 | 4,622 | 4,772 | 4,674 | 5,040 | 5,170 | 4,909 | 4,922 |
| 2000's | 4,819 | 4,957 | 4,469 | 4,353 | 3,921 | 2,939 | 2,775 | 2,731 | 2,250 | 2,377 |
| 2010's | 2,154 | 1,660 | 1,360 | 1,198 | 1,148 | 1,185 | 1,106 | 979 | 921 | 1,005 |
| 2020's | 754 | 721 |
| - = No Data Reported; -- = Not Applicable; NA = Not Available; W = Withheld to avoid disclosure of individual company data. |
| Release Date: 12/30/2022 |
| Next Release Date: NA |