|
Download Data (XLS File) |
|
|||||
|
|||||
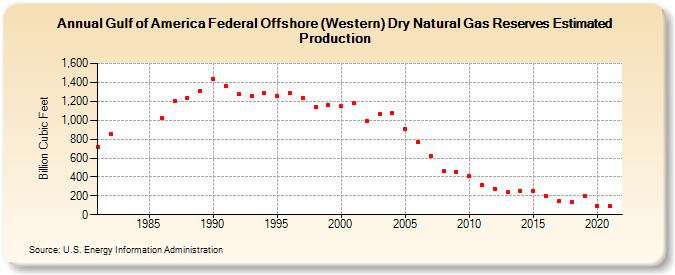
| Gulf of America Federal Offshore (Western) Dry Natural Gas Reserves Estimated Production (Billion Cubic Feet) | |||||
| Decade | Year-0 | Year-1 | Year-2 | Year-3 | Year-4 | Year-5 | Year-6 | Year-7 | Year-8 | Year-9 |
|---|---|---|---|---|---|---|---|---|---|---|
| 1980's | 720 | 855 | 1,025 | 1,203 | 1,235 | 1,311 | ||||
| 1990's | 1,434 | 1,360 | 1,275 | 1,258 | 1,285 | 1,251 | 1,285 | 1,238 | 1,144 | 1,164 |
| 2000's | 1,147 | 1,178 | 996 | 1,062 | 1,072 | 909 | 765 | 625 | 462 | 454 |
| 2010's | 409 | 318 | 277 | 236 | 246 | 251 | 201 | 140 | 136 | 199 |
| 2020's | 96 | 96 |
| - = No Data Reported; -- = Not Applicable; NA = Not Available; W = Withheld to avoid disclosure of individual company data. |
| Release Date: 12/30/2022 |
| Next Release Date: NA |