|
Download Data (XLS File) |
|
|||||
|
|||||
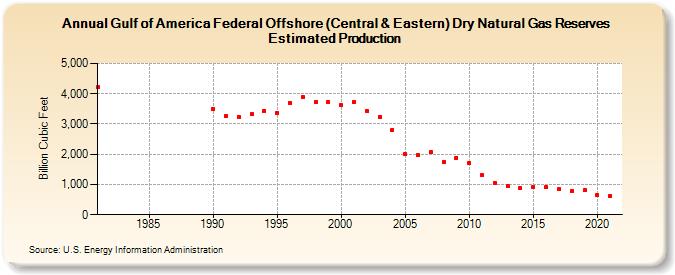
| Gulf of America Federal Offshore (Central & Eastern) Dry Natural Gas Reserves Estimated Production (Billion Cubic Feet) | |||||
| Decade | Year-0 | Year-1 | Year-2 | Year-3 | Year-4 | Year-5 | Year-6 | Year-7 | Year-8 | Year-9 |
|---|---|---|---|---|---|---|---|---|---|---|
| 1980's | 4,210 | |||||||||
| 1990's | 3,509 | 3,267 | 3,233 | 3,319 | 3,440 | 3,376 | 3,706 | 3,895 | 3,728 | 3,721 |
| 2000's | 3,626 | 3,735 | 3,427 | 3,244 | 2,802 | 1,997 | 1,973 | 2,066 | 1,752 | 1,886 |
| 2010's | 1,717 | 1,311 | 1,061 | 941 | 882 | 921 | 902 | 835 | 782 | 804 |
| 2020's | 655 | 622 |
| - = No Data Reported; -- = Not Applicable; NA = Not Available; W = Withheld to avoid disclosure of individual company data. |
| Release Date: 12/30/2022 |
| Next Release Date: NA |