|
Download Data (XLS File) |
|
|||||
|
|||||
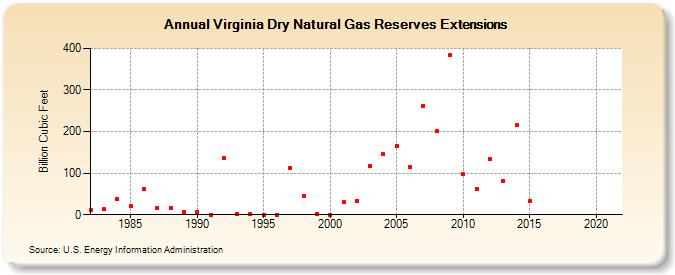
| Virginia Dry Natural Gas Reserves Extensions (Billion Cubic Feet) | |||||
| Decade | Year-0 | Year-1 | Year-2 | Year-3 | Year-4 | Year-5 | Year-6 | Year-7 | Year-8 | Year-9 |
|---|---|---|---|---|---|---|---|---|---|---|
| 1980's | 11 | 13 | 38 | 20 | 61 | 15 | 16 | 6 | ||
| 1990's | 7 | 0 | 136 | 1 | 1 | 0 | 0 | 113 | 45 | 2 |
| 2000's | 0 | 31 | 34 | 117 | 146 | 166 | 114 | 262 | 202 | 383 |
| 2010's | 97 | 63 | 134 | 80 | 215 | 32 | -- | -- | -- | -- |
| 2020's | -- | -- |
| - = No Data Reported; -- = Not Applicable; NA = Not Available; W = Withheld to avoid disclosure of individual company data. |
| Release Date: 12/30/2022 |
| Next Release Date: NA |