|
Download Data (XLS File) |
|
|||||
|
|||||
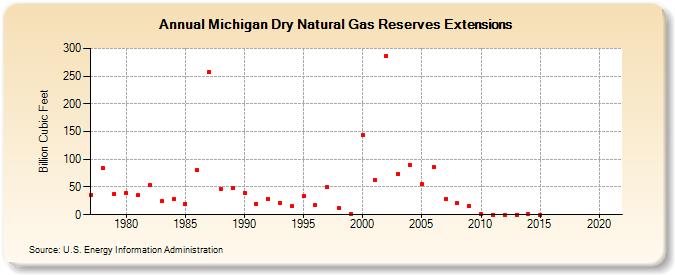
| Michigan Dry Natural Gas Reserves Extensions (Billion Cubic Feet) | |||||
| Decade | Year-0 | Year-1 | Year-2 | Year-3 | Year-4 | Year-5 | Year-6 | Year-7 | Year-8 | Year-9 |
|---|---|---|---|---|---|---|---|---|---|---|
| 1970's | 35 | 84 | 38 | |||||||
| 1980's | 39 | 35 | 53 | 24 | 28 | 20 | 80 | 257 | 47 | 48 |
| 1990's | 40 | 20 | 29 | 22 | 15 | 33 | 17 | 50 | 12 | 2 |
| 2000's | 143 | 63 | 287 | 74 | 90 | 55 | 86 | 29 | 21 | 16 |
| 2010's | 1 | 0 | 0 | 0 | 1 | 0 | -- | -- | -- | -- |
| 2020's | -- | -- |
| - = No Data Reported; -- = Not Applicable; NA = Not Available; W = Withheld to avoid disclosure of individual company data. |
| Release Date: 12/30/2022 |
| Next Release Date: NA |